
Recording local variables using virtual nodes
ESPECIALLY FOR OUR USERSDo you want to evaluate the state of the melt at a specific position or the thermal in the mold as a continuous progression over time? To do this, use sensor nodes in Moldex3D, which record the pressure and temperature during the calculation, for example, in a similar way to real sensors. Click here to learn more!
After the process simulation, all results are available in Moldex3D as false color images for different points in time. At significant time points such as at the changeover point, at complete filling, at the end of the holding pressure phase and residual cooling phase, these results are available by default after the respective analysis sequences have been calculated. In addition, further intermediate time steps can be added in the calculation parameters before the calculation, at which all results for the simulation model can also be viewed as a false color curve after the calculation.
In addition to the results available for the model at discrete points in time, it is possible in Studio to obtain results at concrete measurement points as a curve over time with the help of so-called sensor nodes.
The sensor nodes are defined in the model by adding points, which are then assigned the attribute "sensor node". It is important that these steps are performed during modeling and before final testing of the simulation model. The points for the sensor nodes can be set directly in Moldex3D Studio via the "Drawing tools" tab. Alternatively, positions can be taken from CAD data by importing the points into Moldex3D via a STEP or IGES file format, for example.
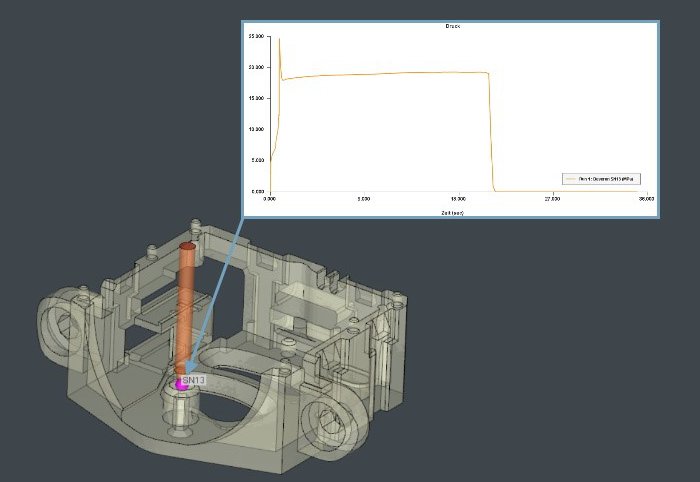
This allows the user, for example, to evaluate the cavity pressure curve at a position close to the sprue in order to obtain additional knowledge regarding component quality and process control. If required, the measured curves of the sensor nodes can also be exported and further processed in external software in order to compare the curves between simulation and reality.